-
Jess Tate
Rob MacLeod
Jess Tate
SCIRun User Mailing List
Text archives Help
- From: mavinmartin@gmail.com
- To: scirun-users@sci.utah.edu
- Subject: [SCIRUN-USERS] matrix mapping SCIRun
- Date: Tue, 23 Apr 2013 20:16:39 -0600
| Hi, I'm trying to make my SCI Run visualize data that is n by n by n. I have sort of figured it out for an n by n matrix imported from matlab; for example, I have a matrix a = [ 1 2; 1 1 ] that is in the format in matlab and I can display it using the following modules as seen below. I use the domainBoundary to split the boundaries of the 1's and 2's. 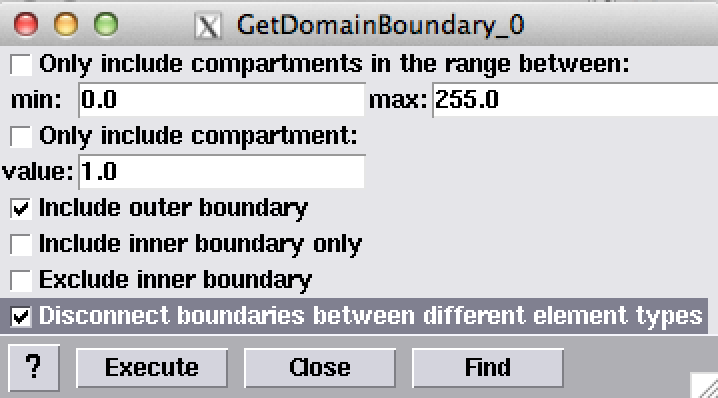 As I try to visualize it, it only shows the edges. I try to check the box under ShowField to include faces but it won't check. Instead it would only show edges for the matrix [1 2; 1 1]. 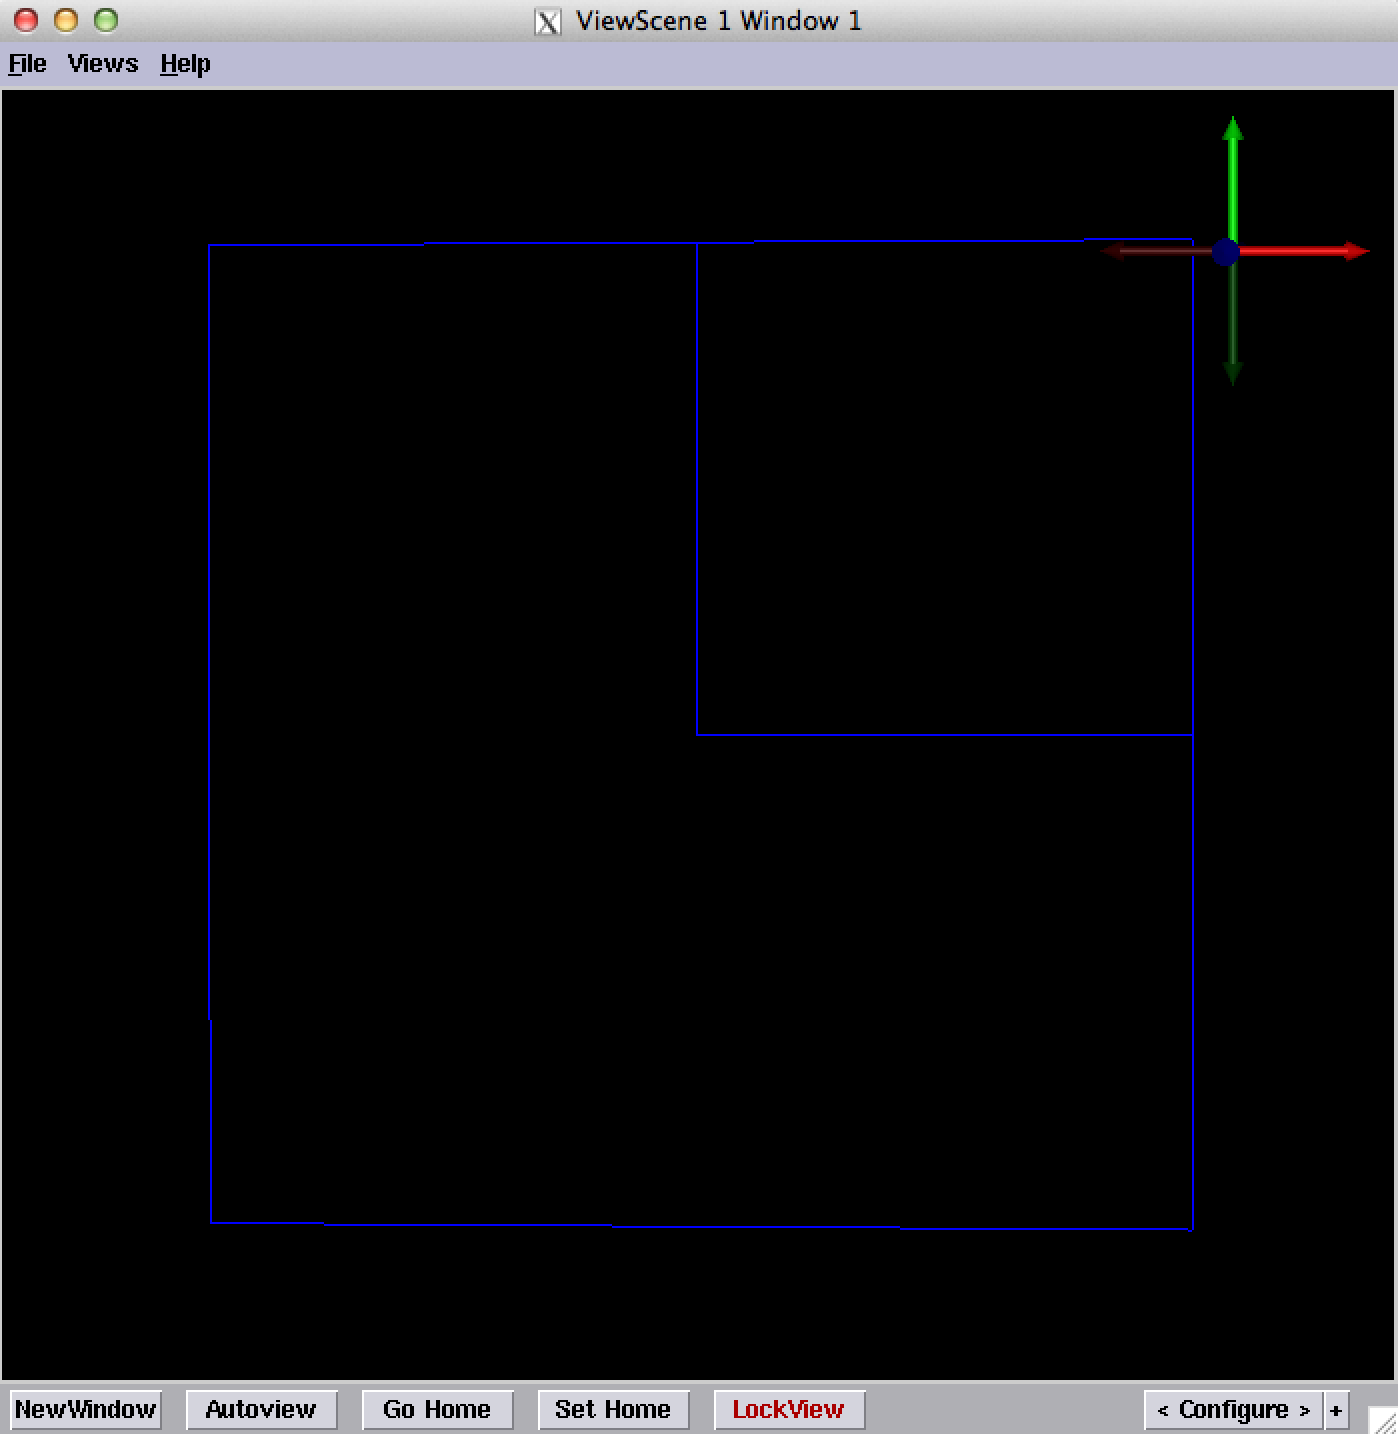 Is there a way to turn these into face meshes where each region would be a different color if I have different mappings of 1's, 2's, 3's, etc? Also, is there a way I can import n by n by n 3d matrices from matlab or from a file into SCIRun? Also, if you have any tutorials that may be applicable to this please direct me there also. Thanks again, Mavin |
- [SCIRUN-USERS] matrix mapping SCIRun, mavinmartin, 04/23/2013
- [SCIRUN-USERS] Re: matrix mapping SCIRun, Jess Tate, 04/24/2013
- [SCIRUN-USERS] Re: matrix mapping SCIRun, mavinmartin, 04/24/2013
- [SCIRUN-USERS] Re: matrix mapping SCIRun, Jess Tate, 04/24/2013
Archive powered by MHonArc 2.6.16.