-
jess
macleod
Shireen Elhabian
Text archives Help
- From: AMY LORRAINE LENZ <amy.lenz@utah.edu>
- To: "shapeworks-users@sci.utah.edu" <shapeworks-users@sci.utah.edu>
- Subject: [shapeworks-users] Feature Request for PCA Modes Visualization
- Date: Thu, 7 Nov 2019 23:01:23 +0000
- Accept-language: en-US
Hi All,
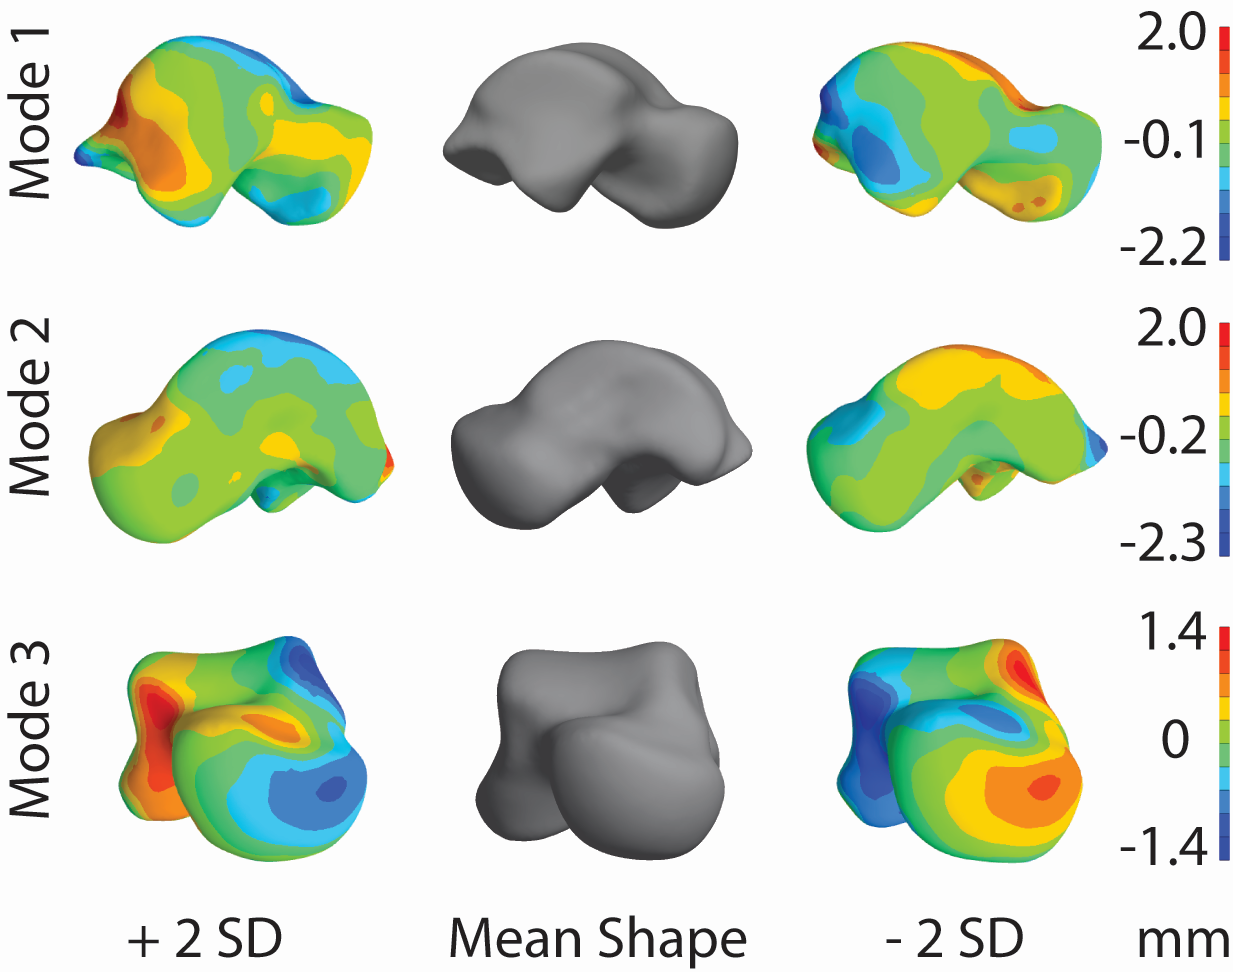
I have a feature request for visualizing modes of variations. Currently I use a distance map tool to create fringe plots in PostView (https://febio.org/postview/). This creates a distance comparison between +/- 2 SD from the mean shape to highlight anatomical features. See below an example of visualizing 3 modes of variation resulting from a ShapeWorks model of the talus (one ankle bone). To do this I compare the mean shape to the +2SD surface and additionally compare the mean shape to the -2SD surface. In the situation of presenting findings in manuscripts or posters, it provides a nice visual with color distinction of where differences reside. Do you think this is something that could be easily included in View2 or the new ShapeWorksStudio analysis tab?
Thanks!
Amy
- [shapeworks-users] Feature Request for PCA Modes Visualization, AMY LORRAINE LENZ, 11/07/2019
- Re: [shapeworks-users] Feature Request for PCA Modes Visualization, Shireen Elhabian, 11/07/2019
Archive powered by MHonArc 2.6.18.