-
jess
macleod
Shireen Elhabian
shapeworks-users
Text archives Help
- From: wenzheng tao <wztao@cs.utah.edu>
- To: Shapeworks Users <shapeworks-users@sci.utah.edu>
- Subject: [shapeworks-users] Questions about warping mean mesh and visualizing normals
- Date: Mon, 01 Aug 2022 17:14:34 -0600
Hello,
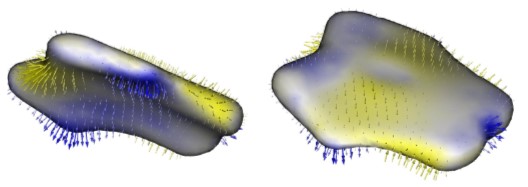
I am using Shapeworks to do shape analysis on some soft tissues and I would like to visualize the group difference in a way similar to the attached "norm_vec.png". It is a figure from [1], just as an example. I am wondering if Shapeworks has built in functions that can help me achieve the goals and I think there are mainly 2 questions.
1. Is there a way to get a nice mean mesh for a subgroup?
I assume it needs these steps: export the mean mesh from Shapeworks Studio, average the particles of the subjects in a selected group, warp the mean mesh to match the average particles. Does Shapeworks have these functions (I can do the averaging in Python)?
2. Can shapeworks visualize normal vectors with colored arrows?
I'd like to get a similar figure like the attached "norm_vec.png".
Thanks for your help!
Wenzhneg
Ref:
[1] Cates, Joshua, Lisa Nevell, Suresh I. Prajapati, Laura D. Nelon, Jerry Y. Chang, Matthew E. Randolph, Bernard Wood, Charles Keller, and Ross T. Whitaker. "Shape analysis of the basioccipital bone in Pax7-deficient mice." Scientific reports 7, no. 1 (2017): 1-10.
Attachment:
norm_vec.jpg
Description: JPEG image
- [shapeworks-users] Questions about warping mean mesh and visualizing normals, wenzheng tao, 08/01/2022
- Re: [shapeworks-users] Questions about warping mean mesh and visualizing normals, Alan Morris, 08/02/2022
- RE: [shapeworks-users] Questions about warping mean mesh andvisualizing normals, Wenzheng Tao, 08/03/2022
- Re: [shapeworks-users] Questions about warping mean mesh andvisualizing normals, Alan Morris, 08/03/2022
- RE: [shapeworks-users] Questions about warping mean meshandvisualizing normals, Wenzheng Tao, 08/03/2022
- Re: [shapeworks-users] Questions about warping mean mesh andvisualizing normals, Alan Morris, 08/03/2022
- RE: [shapeworks-users] Questions about warping mean mesh andvisualizing normals, Wenzheng Tao, 08/03/2022
- Re: [shapeworks-users] Questions about warping mean mesh and visualizing normals, Alan Morris, 08/02/2022
Archive powered by MHonArc 2.6.18.