-
jess
macleod
Shireen Elhabian
Text archives Help
- From: Wenzheng Tao <wztao@cs.utah.edu>
- To: Alan Morris <alan.morris@utah.edu>, "shapeworks-users@sci.utah.edu" <shapeworks-users@sci.utah.edu>
- Subject: RE: [shapeworks-users] Questions about warping mean meshandvisualizing normals
- Date: Wed, 3 Aug 2022 18:58:58 -0600
- Importance: normal
Thanks for your help, Alan! I find that configuring the scale only works when “Uniform scale” is checked. I didn’t have it checked previously and I thought it is not configurable. Now it looks good. Thanks again! Wenzheng
From: Alan Morris
Hi Wenzheng,
1) Previous versions of Studio scaled the difference vectors based on the glyph size slider, but there was feedback that users wanted the vectors to show the actual length/magnitude. We will have to add some option to switch between the two modes.
2) The colormaps are very configurable. You can choose in preferences and you can adjust the lower and upper bounds at the bottom.
3) I’d suggest using Normals and possibly Geodesics.
Thanks, Alan
From: Wenzheng Tao <wztao@cs.utah.edu>
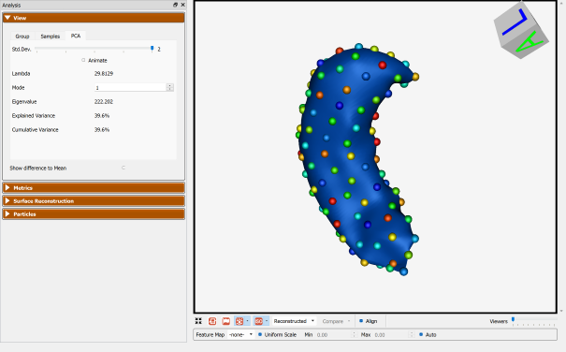
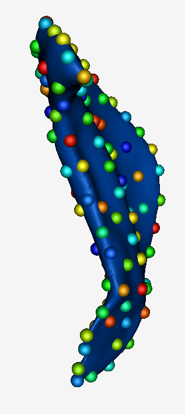
Hi Alan, Thanks a lot for your help! This feature is great and I have got some nice looking visualizations (shape mean and difference shown below). Can I ask a few more questions? Just curious about some finer adjustments.
The arrows seem small and hard to see now. Perhaps this is just a result of too few particles.
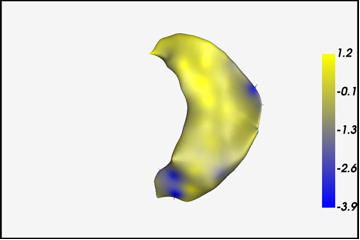
It seem 0 is mapped to yellow in the current mapping. I think in our case it would be preferable to map it to black.
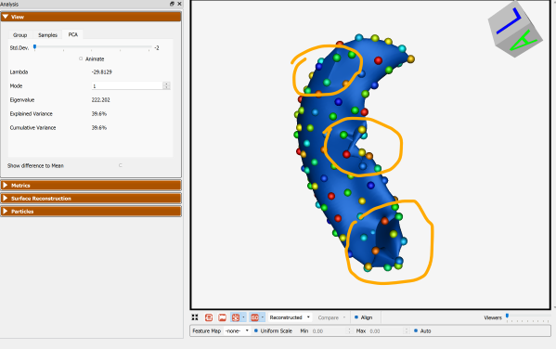
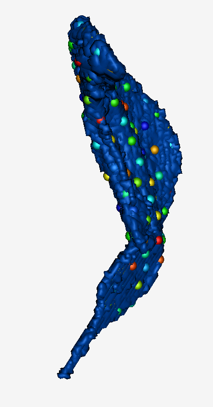
It has some mismatching issues when the particle number is increased from 64 to 128 (shown below, figures from left to right show the deformation of the first principal component, mismatched areas are circled in orange).
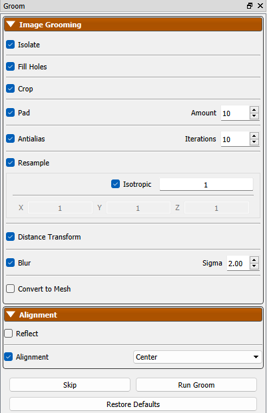
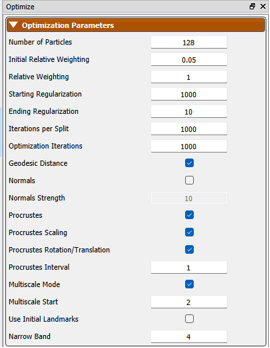
Here are the original segmentation, groom parameters, groomed segmentation and optimization parameters:
Thank you! Wenzheng
From: Alan Morris
Hi Wenzheng,
Yes, this functionality is available in Studio, for example:
http://sciinstitute.github.io/ShapeWorks/latest/studio/studio-analyze.html#group
If you click the 'mean' for each group, you can export the reconstructed mesh from the File->Export menu.
Let me know if you have further questions.
Thanks, Alan
On 8/1/22, 5:15 PM, "shapeworks-users-request@sci.utah.edu on behalf of wenzheng tao" <shapeworks-users-request@sci.utah.edu on behalf of wztao@cs.utah.edu> wrote:
Hello,
I am using Shapeworks to do shape analysis on some soft tissues and I would like to visualize the group difference in a way similar to the attached "norm_vec.png". It is a figure from [1], just as an example. I am wondering if Shapeworks has built in functions that can help me achieve the goals and I think there are mainly 2 questions.
1. Is there a way to get a nice mean mesh for a subgroup? I assume it needs these steps: export the mean mesh from Shapeworks Studio, average the particles of the subjects in a selected group, warp the mean mesh to match the average particles. Does Shapeworks have these functions (I can do the averaging in Python)?
2. Can shapeworks visualize normal vectors with colored arrows? I'd like to get a similar figure like the attached "norm_vec.png".
Thanks for your help! Wenzhneg
Ref: [1] Cates, Joshua, Lisa Nevell, Suresh I. Prajapati, Laura D. Nelon, Jerry Y. Chang, Matthew E. Randolph, Bernard Wood, Charles Keller, and Ross T. Whitaker. "Shape analysis of the basioccipital bone in Pax7-deficient mice." Scientific reports 7, no. 1 (2017): 1-10.
|
Attachment:
image001.png
Description: PNG image
Attachment:
image002.png
Description: PNG image
Attachment:
image003.png
Description: PNG image
Attachment:
image004.png
Description: PNG image
Attachment:
image005.png
Description: PNG image
Attachment:
image006.png
Description: PNG image
Attachment:
image007.png
Description: PNG image
Attachment:
image008.png
Description: PNG image
- [shapeworks-users] Questions about warping mean mesh and visualizing normals, wenzheng tao, 08/01/2022
- Re: [shapeworks-users] Questions about warping mean mesh and visualizing normals, Alan Morris, 08/02/2022
- RE: [shapeworks-users] Questions about warping mean mesh andvisualizing normals, Wenzheng Tao, 08/03/2022
- Re: [shapeworks-users] Questions about warping mean mesh andvisualizing normals, Alan Morris, 08/03/2022
- RE: [shapeworks-users] Questions about warping mean meshandvisualizing normals, Wenzheng Tao, 08/03/2022
- Re: [shapeworks-users] Questions about warping mean mesh andvisualizing normals, Alan Morris, 08/03/2022
- RE: [shapeworks-users] Questions about warping mean mesh andvisualizing normals, Wenzheng Tao, 08/03/2022
- Re: [shapeworks-users] Questions about warping mean mesh and visualizing normals, Alan Morris, 08/02/2022
Archive powered by MHonArc 2.6.18.